

One of the most impactful things for any business is the ability to synthesize data and report well. One of the basic ways that we do this as business professionals, especially when starting out, is goal setting.
Goal setting can be useful when we think about things like sales volume for reps, over all company revenue, and things like MQLs (Marketing Qualified Leads) generated in a specific period of time.
However, sometimes, getting used to reporting in a new tool can be difficult. Even if you’ve been using a tool for a while, you might not know some of the more nuanced ins and outs. That being said, I figured I would take a second to very briefly explain how to set goals in custom reports in HubSpot.
What Reports Can Use Goals
Inside of HubSpot, there is some pre-built reporting around goals associated to sales and service-related properties and activities. You can also edit and add to these goals (let me know in the comments below if you want more info on this).
But what if you want to set goals surrounding something like number of clicks on a marketing email sent to leads, or MQLs generated in a quarter? Enter: Line and Area charts.
Inside of the single object report builder in HubSpot, the line and area chart types will allow you to set goals to compare against in the report.
How to Set Goals Inside of HubSpot’s Single Object Report
So, in order to set goals inside of a HubSpot report, you’ll need to start with choosing the single object report builder. From here, you’ll want to choose the appropriate object. For my example, I’ll be using a contact object report.
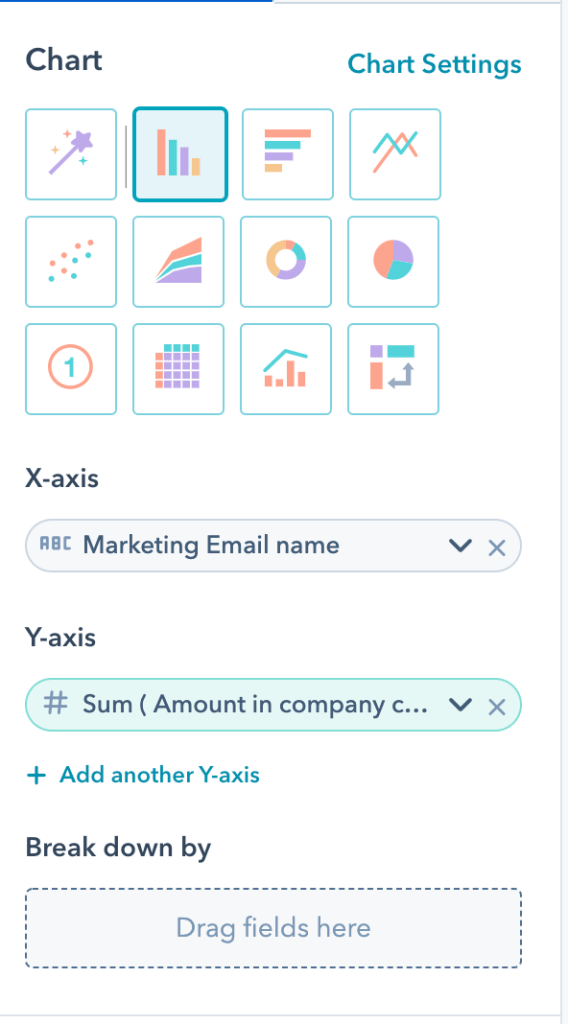
After you choose your report, you’ll be asked to choose your different properties, you can drag and drop your properties into the appropriate fields as pictured below.
After you choose your properties, you’ll then want to ensure that you have the proper filters set. You’ll want to go into the upper left-hand corner of the report builder and then click on filters, from there, you’ll get the display below. You’ll then be able to search for and select the filters that are appropriate.
Maybe you’re interested in looking at only the number of MQLs generated in the quarter. Then you’ll want to filter by lifecycle stage and select ‘lifecycle stage is any of MQL’ and no other stages like I’ve done below.

Once you’ve done that, you’ll want to select the Line or Area Chart Type and then change over to the visualization tab.
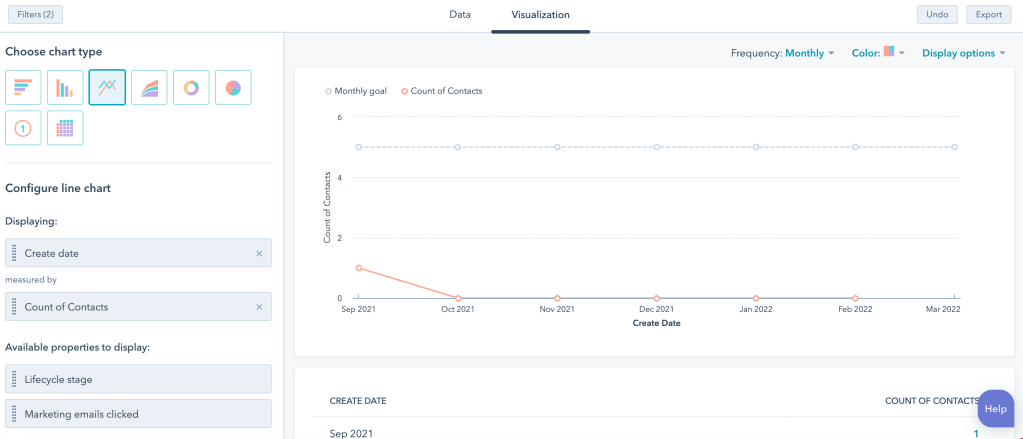
After you change over to the visualization tab, you’ll want to go up to the top right corner where it says display options. If you have the Line or Area Chart Type selected, you’ll see the ability to add goals in the drop down. From there you can input your goal and it will appear on the chart!

Now that you’ve got your goal in place, you can begin putting efforts in place to meet and exceed it!
Hopefully this walk through helps what can be a little tricky. If it doesn’t make sense, let me know below and I can put together a better explanation and walk through!
